Historical Performance Analytics - SitePulse
Real-time uptime monitoring for everyone
Explore Dashboard Download ReportsData Visualization
Interactive Dashboard Preview
Track your infrastructure's performance trends with granular, time-series visualizations. Our dashboard renders response latency, packet loss, and TLS certificate validity across global probe locations including Ashburn, Frankfurt, Tokyo, and São Paulo.
Core Analytics
Performance Metrics & Data Retention
Historical Data Retention
Free Tier
Access up to 365 days of historical uptime logs, DNS resolution records, and HTTP status code archives. Enterprise plans unlock unlimited retention with hourly granularity.
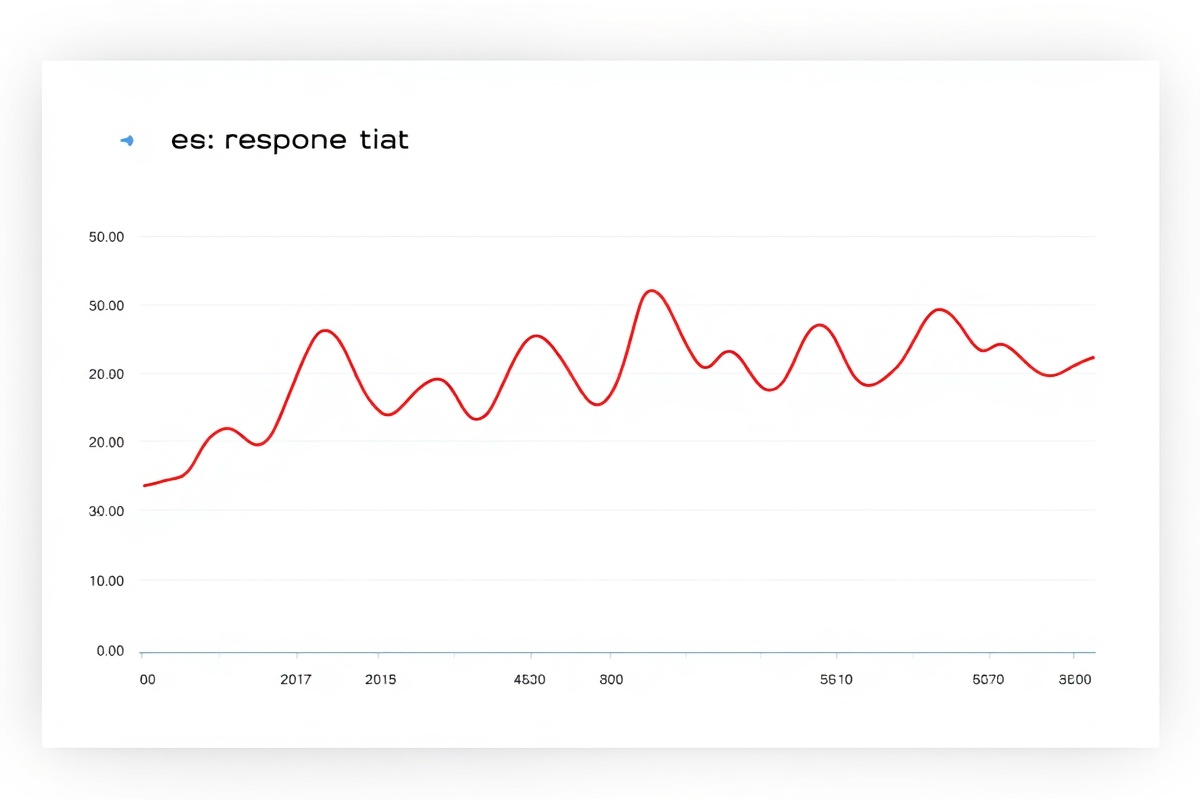
Response Time Tracking
Global Probes
Monitor TCP handshake duration, TLS negotiation overhead, and first-byte latency. Baseline averages currently show 42ms for US East and 118ms for APAC regions.
Availability Scoring
SLA Compliance
Calculate precise uptime percentages down to four decimal places. Automatically flag degradation events exceeding 200ms thresholds and generate incident timelines.
Reporting
Export Options & Compliance Reports
Generate audit-ready documentation for stakeholders, security reviews, and SLA verification. All exports include cryptographic checksums and timestamped probe signatures.
Choose between machine-readable CSV datasets for custom BI pipelines or branded PDF reports featuring executive summaries, trend analysis, and recommendation matrices. Schedules support daily, weekly, or monthly automation via webhooks or direct email delivery to compliance@yourdomain.com.
Export CSV Dataset Generate PDF Report